Junction's Inspection mode will parse all packets passing through the VPG and send statistical information to a specified cloud service using a service adapter. From the cloud service, the data can then be connected with a tool in order to build visualizations and perform network analysis.
The following cloud service adapters are available:
- Amazon Kinesis Data Streams
- Amazon Data Firehose
- AWS IoT
- Microsoft Azure Event Hubs
- Google Cloud Pub/Sub
Example Implementation
As each adapter provides access to different cloud services, implementation instructions will vary according to the data analysis tools you use. This guide demonstrates a practical implementation of Junction Inspection with the following architecture:
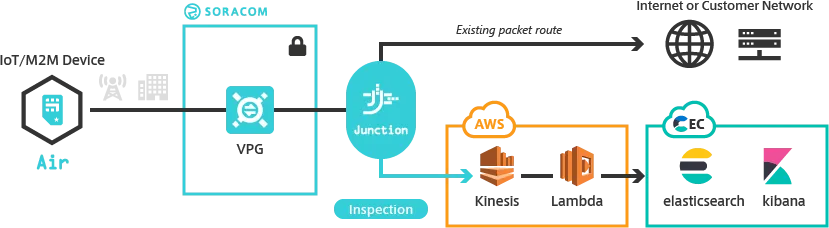
- Deliver packet statistics to Amazon Kinesis Data Streams.
- Add an AWS Lambda function to format the data and transfer it to Elastic Cloud.
- Analyze the data using Elasticsearch.
- Build packet visualization with Kibana.
Requirements
- A Virtual Private Gateway
- An AWS account
- An Elastic Cloud account
Elastic Cloud Setup
Let's first start by setting up Elasticsearch and Kibana on Elastic Cloud. If you don't have an account, you can sign up for a 14-day trial .
-
Log in to Elastic Cloud.
-
Click Create Cluster.
-
Enter the following options:
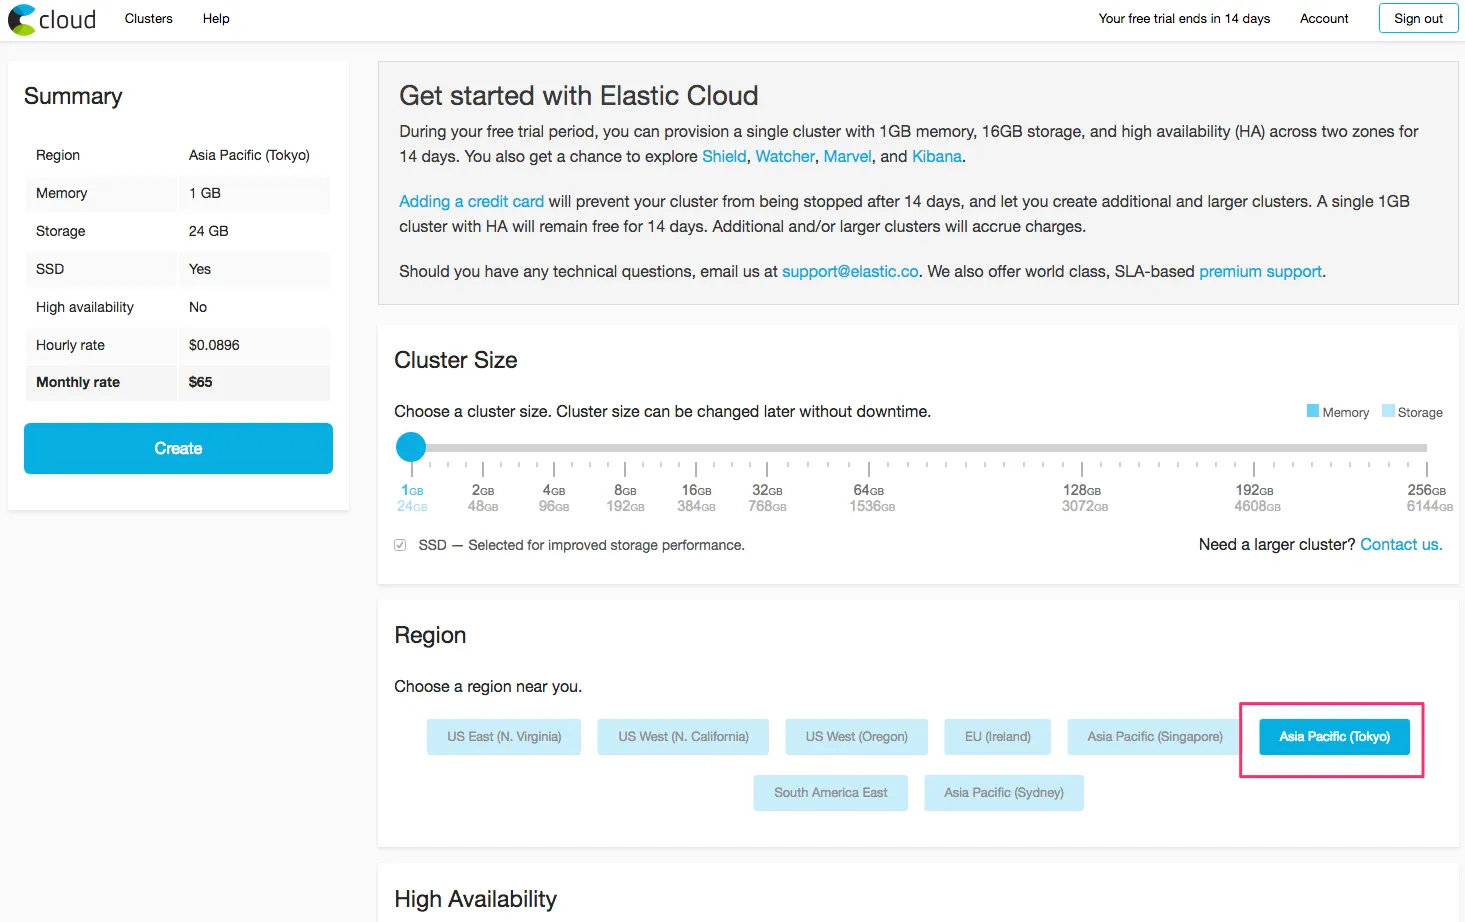
- Cluster Size -
1GBmemory and24GBstorage. - Region - Select a region near you.
Keep the defaults for the remaining options, then create the cluster.
- Cluster Size -
-
Once the cluster is created, a
elasticuser and its password will be displayed. Make a note of this information, as we will need it later. -
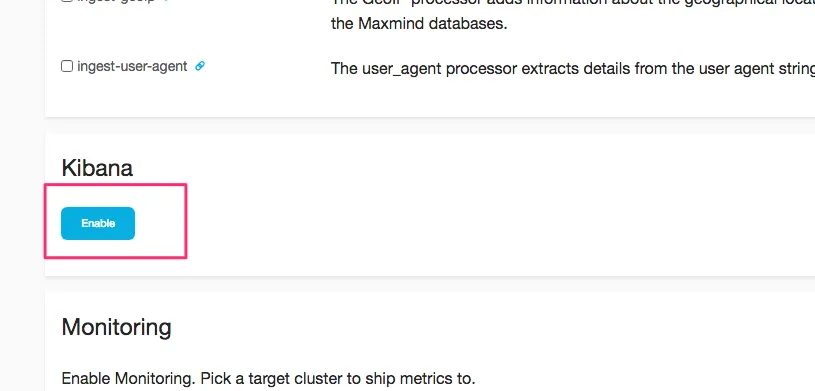
Next, from the Kibana section, click the Enable button.
Now we need to test that we can connect to Elasticsearch.
-
Open the cluster Overview page. Then from the Endpoints section, click HTTPS. Use the
elasticusername and password noted earlier to authenticate the connection. If successful, you should see a JSON response similar to the following: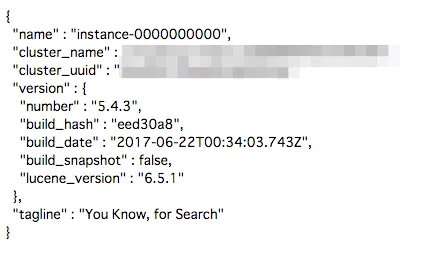
-
We also need to check that we can access Kibana. Follow the same process, using the same
elasticusername and password from earlier.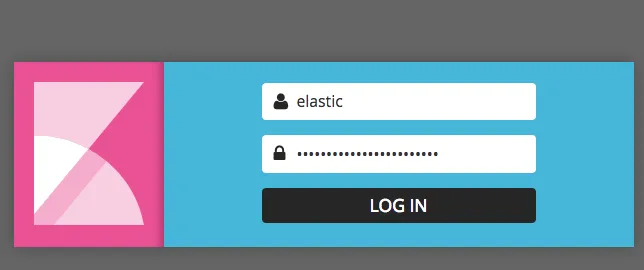
Last, we need to register a template in Elasticsearch, which will tell Elasticsearch about the format of the statistical data that Junction will be sending.
-
Download the Soracom Realtime VPG Metrics template file to your computer.
-
Register it to Elasticsearch by making an HTTP PUT request to your cluster's HTTPS endpoint, specifying the
elasticusername and password, and using the template file as the HTTP request body:curl -X PUT \ | -H 'Content-Type:application/json' \ | --user elastic:<PASSWORD> \ | -d '@/path/to/soracom-realtime-vpg-metrics-template.json' \ | "https://xxxxxxxxxxxxxxxxxx.ap-northeast-1.aws.found.io:9243/_template/soracom-vpg"Elasticsearch will return a
{"acknowledged":true}response when the template is successfully registered.
Amazon Kinesis Data Streams Setup
Next, we need to set up an Amazon Kinesis Data Stream, which is where Junction will send Inspection data.
-
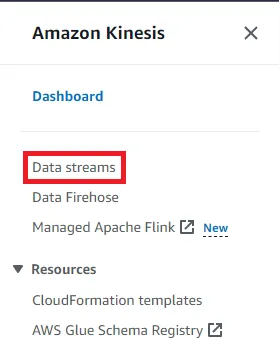
Sign in to the AWS Management Console . From the Services menu, open the Kinesis dashboard. Then click the Data streams button.
-
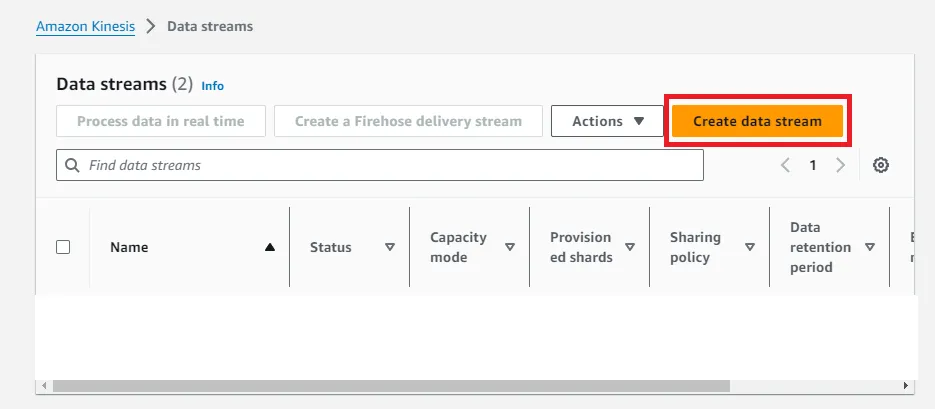
Click the Create data stream button.
-
Enter a name for this stream, such as
junction-inspection-escloud. We will keep the default settings for this stream. Then click the Create data stream button.
After the Kinesis Data Stream has been created, we need to create credentials that Junction can use in order to connect to Kinesis Data Streams. For security, we will create a new AWS IAM role that only has access to Kinesis Data Streams.
-
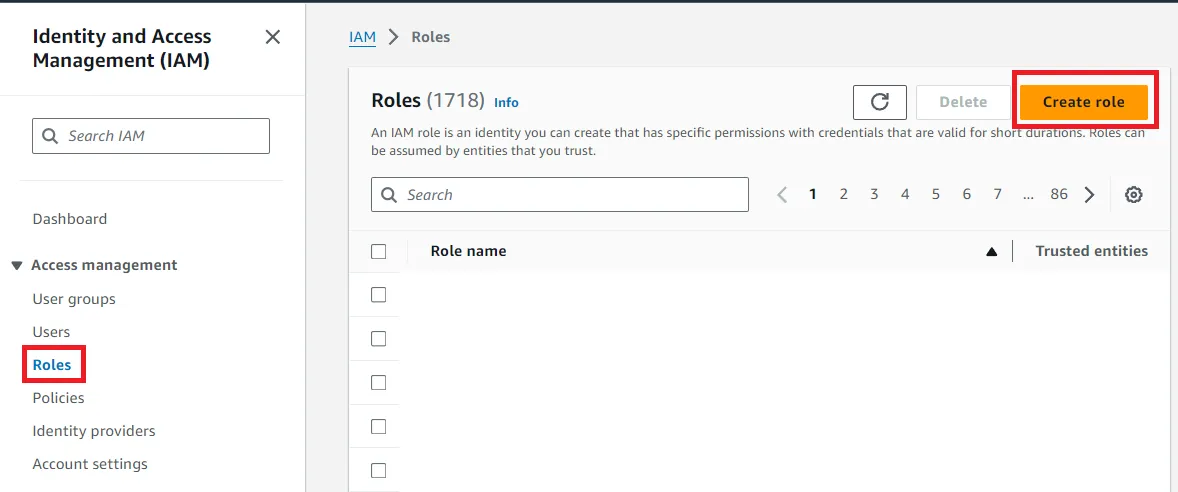
From the AWS Services menu, open the IAM dashboard. Then from the Roles, click the Create role button.
-
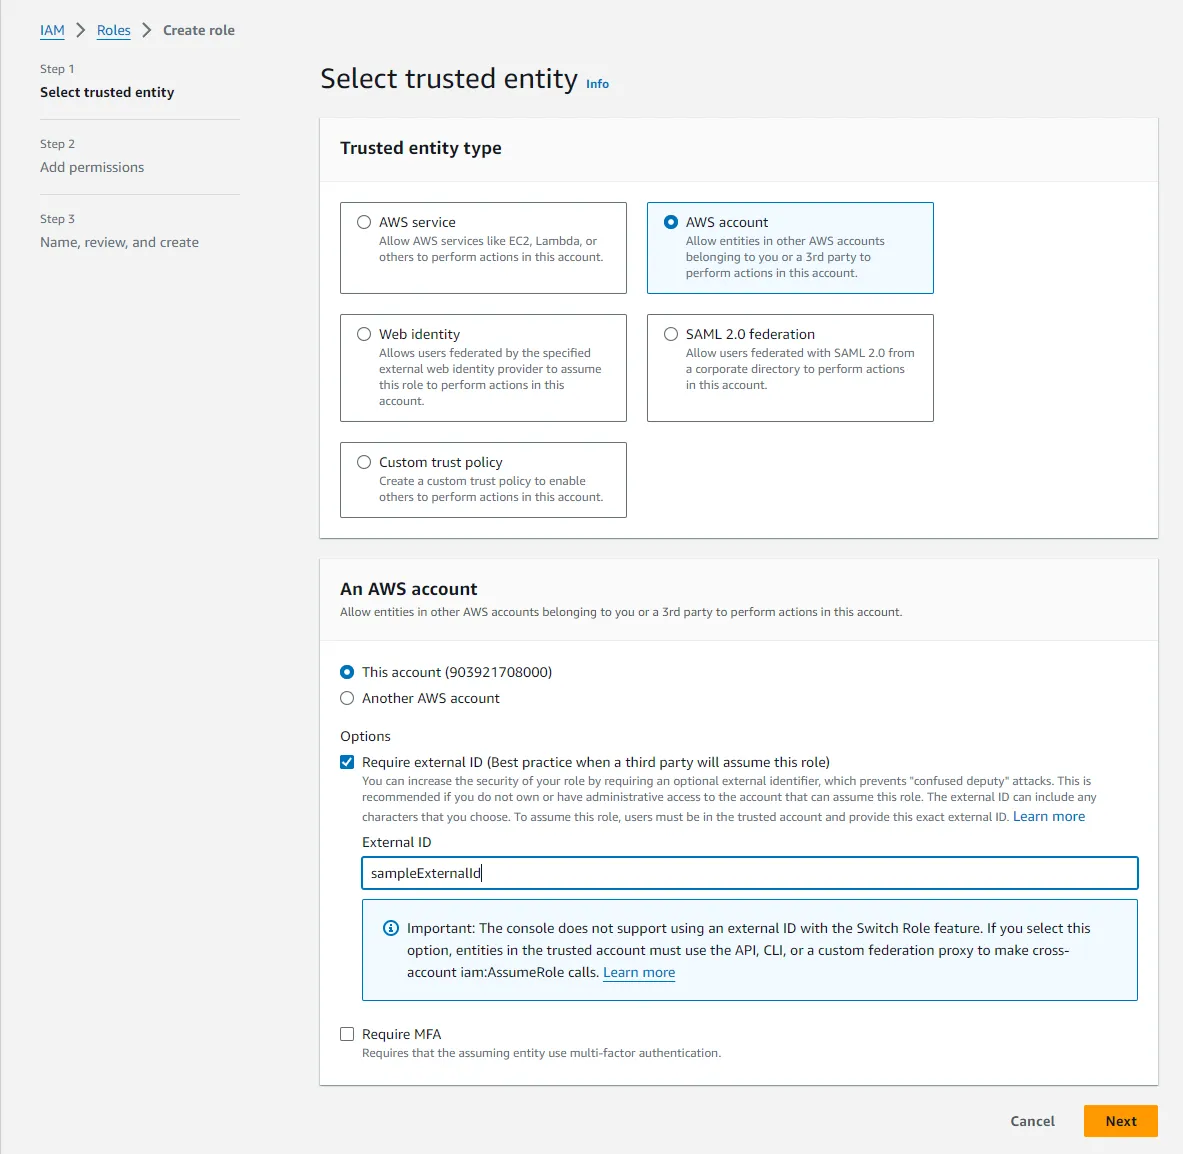
Select AWS account as the trusted entity type and add an External ID. This External ID will be needed for our Soracom Credential Set later. Then click Next.
-
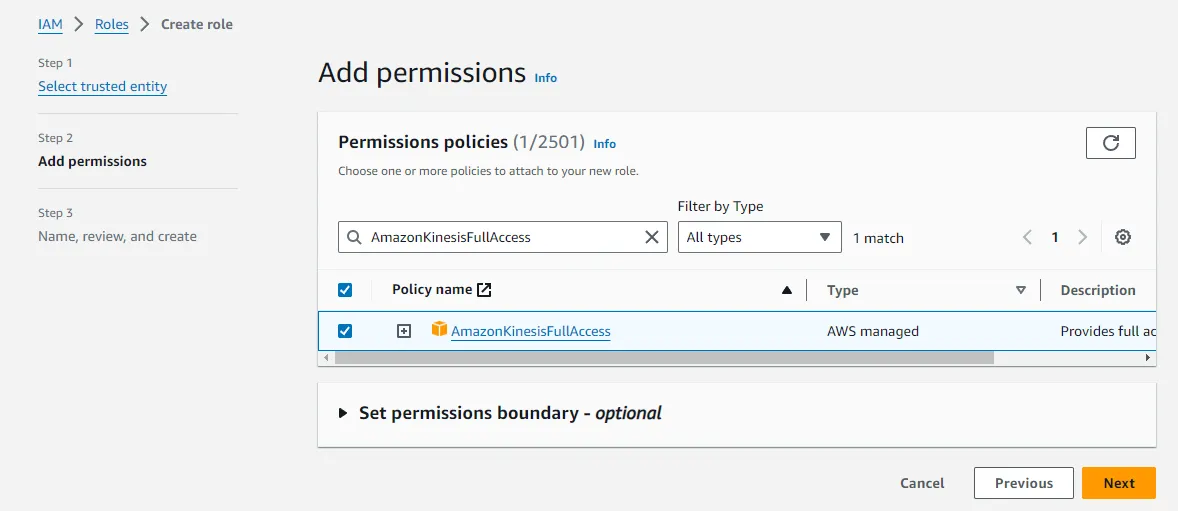
Select AmazonKinesisFullAccess as the permission policy and click Next.
-
Enter a descriptive name for the role, then click Create role.
-
From the main Roles screen, click on your newly created role and make a note of the Role ARN. This will be needed for the creation of our Soracom Credential Set later.
Lambda Setup
Now with Elasticsearch and Kinesis Data Streams set up, we can create a Lambda function that will take care of sending our Inspection data from Kinesis Data Streams to Elasticsearch.
In order to let Lambda access Kinesis Data Streams, we need to set up a Role.
-
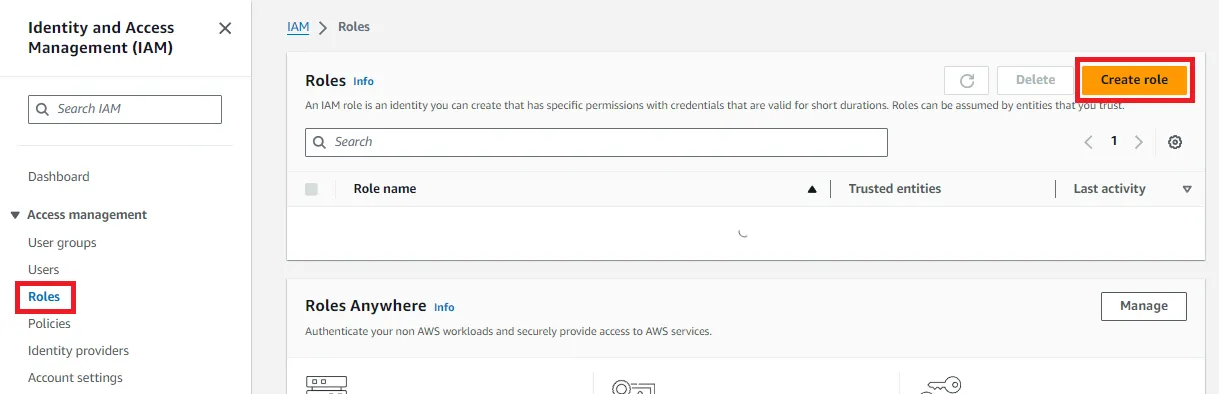
In the IAM dashboard, click the Roles section. Then click the Create role button.
-
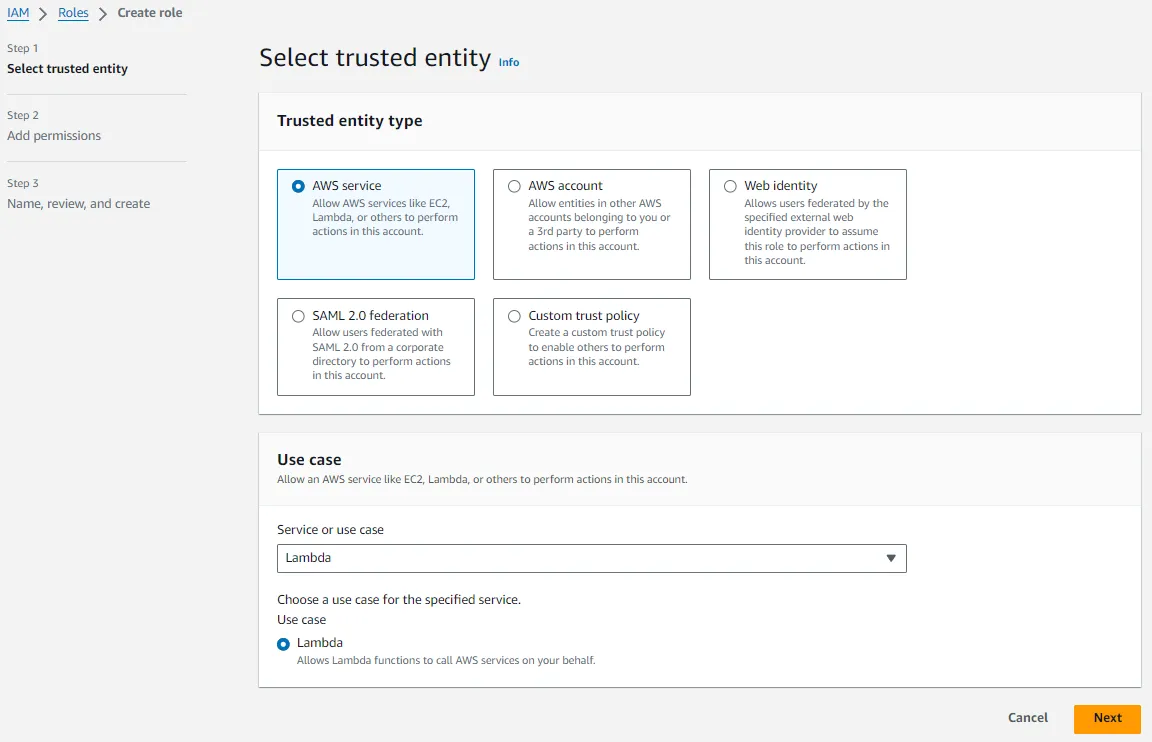
In the Select role type screen, select AWS service. Under Use case, select Lambda. Then click Next.
-
In the Add permissions screen, search for the
AWSLambdaKinesisExecutionRolepolicy and click its to attach it to the new role. Then click Next.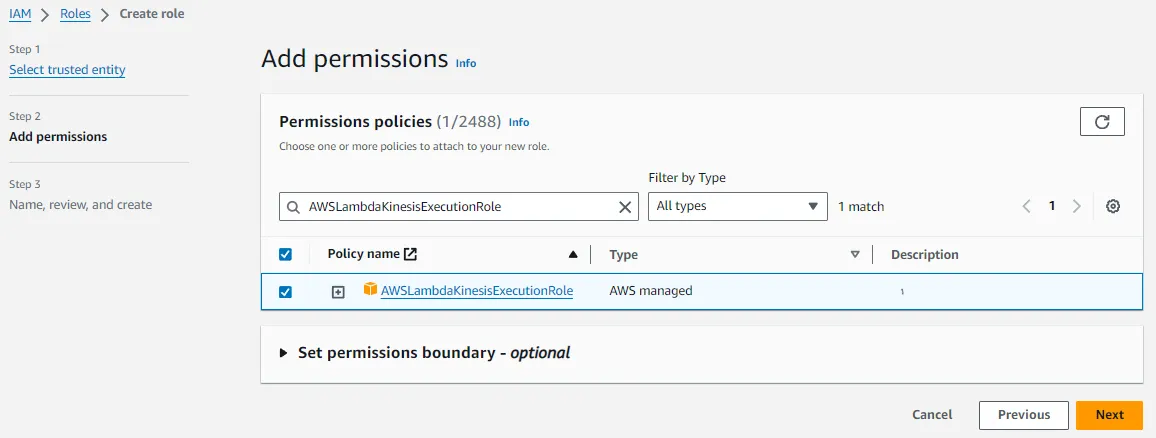
-
Last, enter a Role name. We will use this role when setting up Lambda next. Here, we use the name
lambda_kinesis_execution. Leave the rest of the settings as default and click Create role.
Now we can create the Lambda function.
-
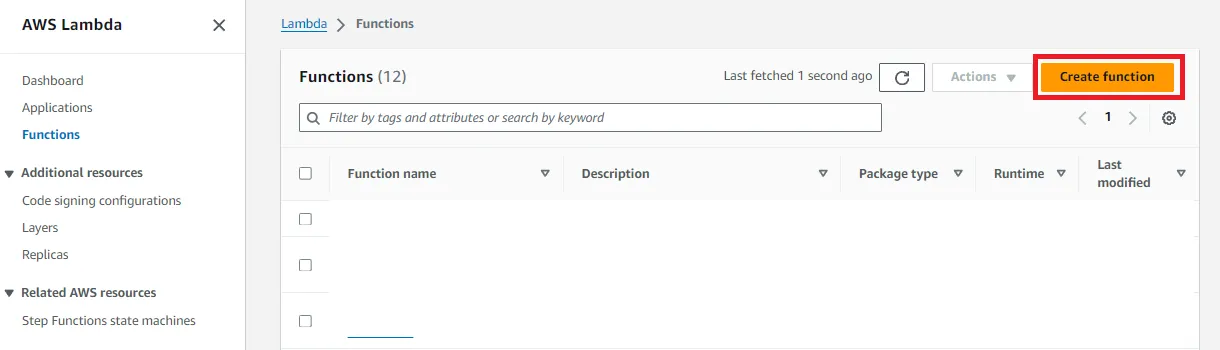
From the AWS Services menu, open the Lambda dashboard. Click the Create function button.
-
Using the Author from scratch option, enter a descriptive function name, then choose
Python 3.8under Runtime andx86_64under Architecture. Under Permissions click Use an existing role, then select thelambda_kinesis_executionwe created earlier. Finally, click Create function.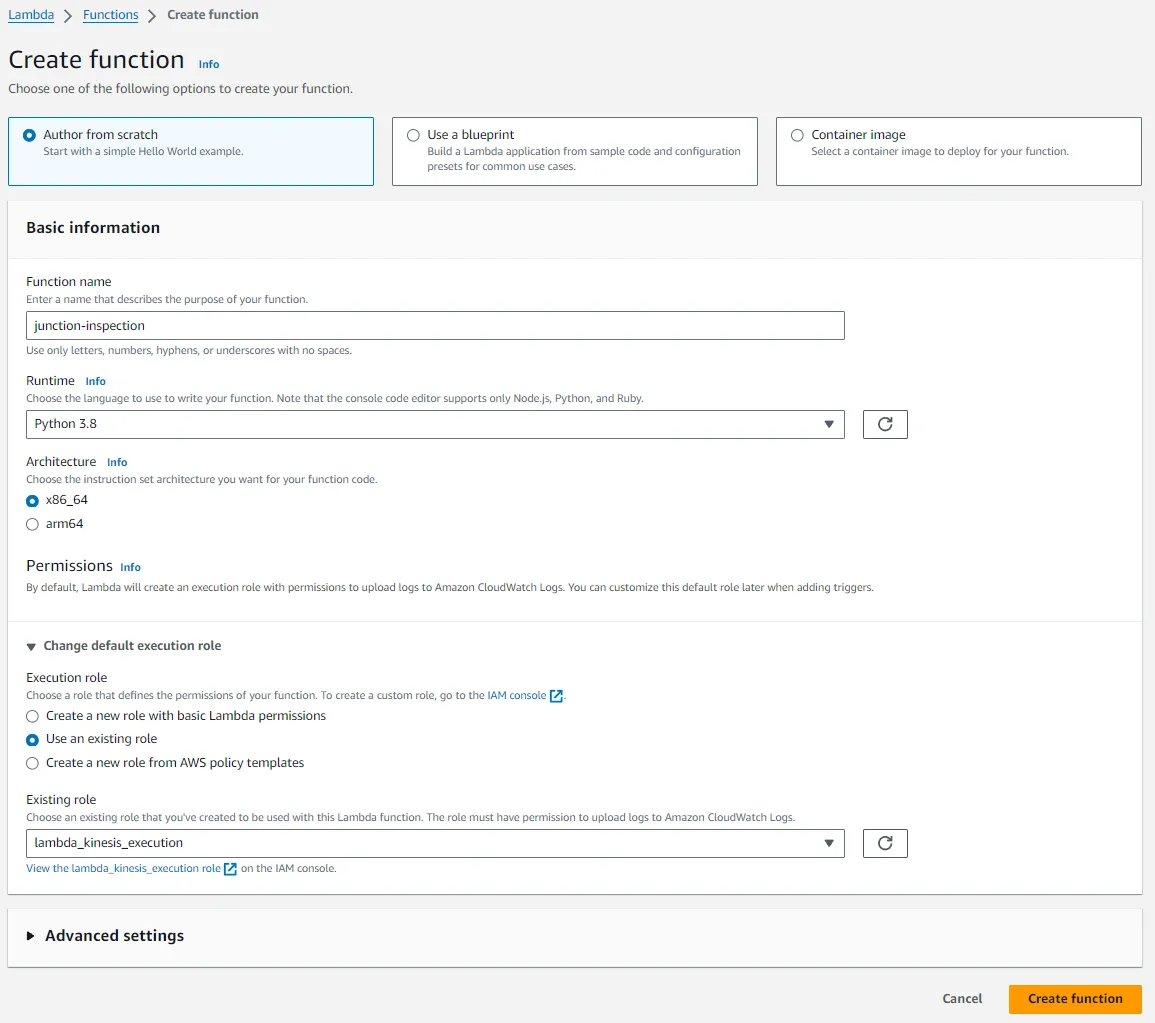
-
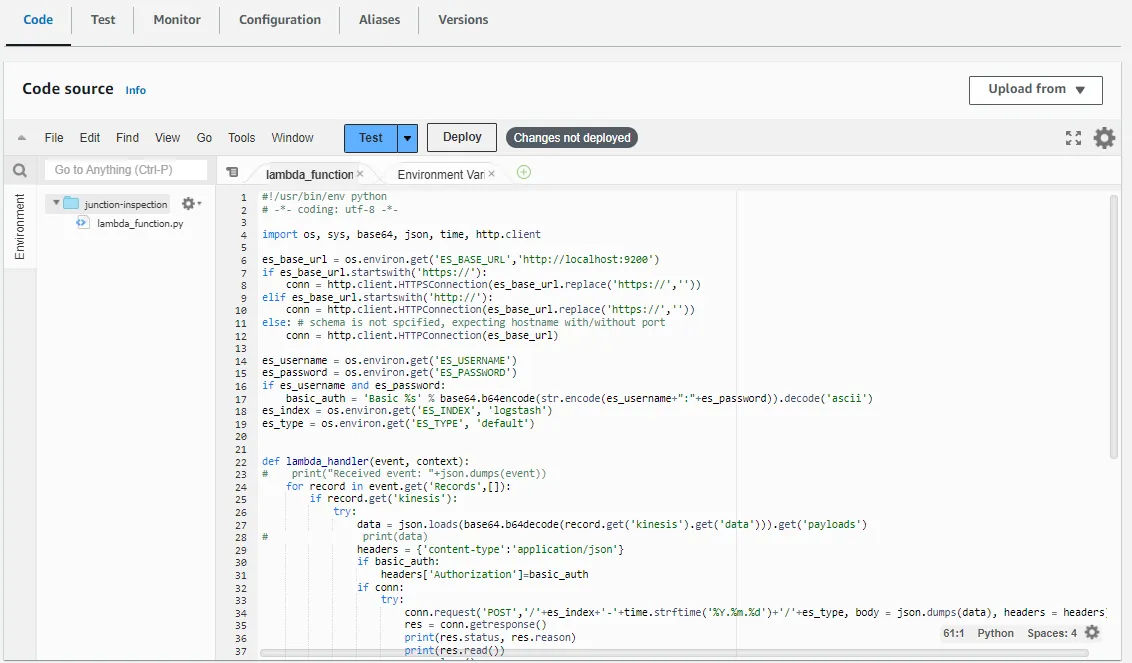
In the Code source section copy and paste the Soracom Junction Lambda function code.
-
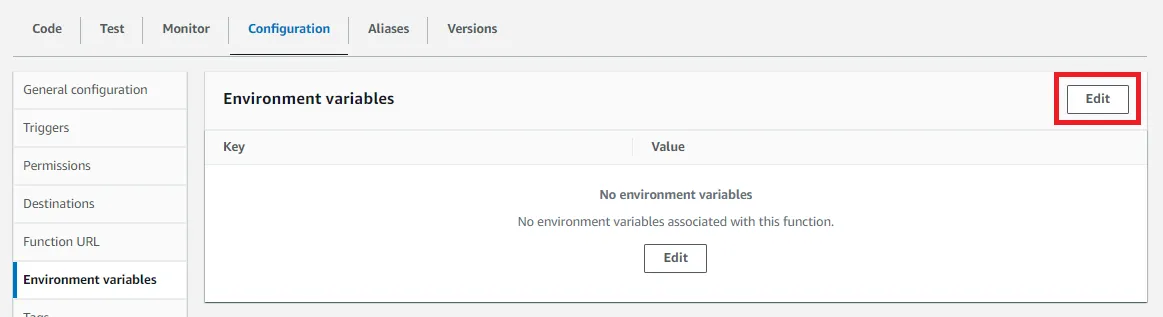
The Elasticsearch cluster endpoint and credentials can now be configured as environment variables. Under the Configuration tab click Environment variables, then click Edit.
-
Add the following environment variables then click Save:
Key Value ES_BASE_URLYour Elasticsearch cluster HTTPS endpoint, without the trailing /.ES_USERNAMEelasticES_PASSWORDThe password created earlier for the elasticuser.ES_INDEXA prefix added to the data. Set this as soracom, as this is the format the Elasticsearch template expects.ES_TYPEStats
Configure Junction
So far, we've completed the following configuration:
- Elasticsearch - We registered the packet inspection template, and our cluster is ready to accept data at its endpoint.
- Kinesis Data Stream - Our Kinesis Data Stream is set up, and the IAM user we created to access it is ready.
- Lambda - Our function is ready to send data from our Kinesis Data Stream to Elasticsearch.
Let's configure our VPG to send Inspection data to our Kinesis Data Stream.
Follow the Inspection configuration instructions from the Junction Configuration documentation, providing the following parameters:
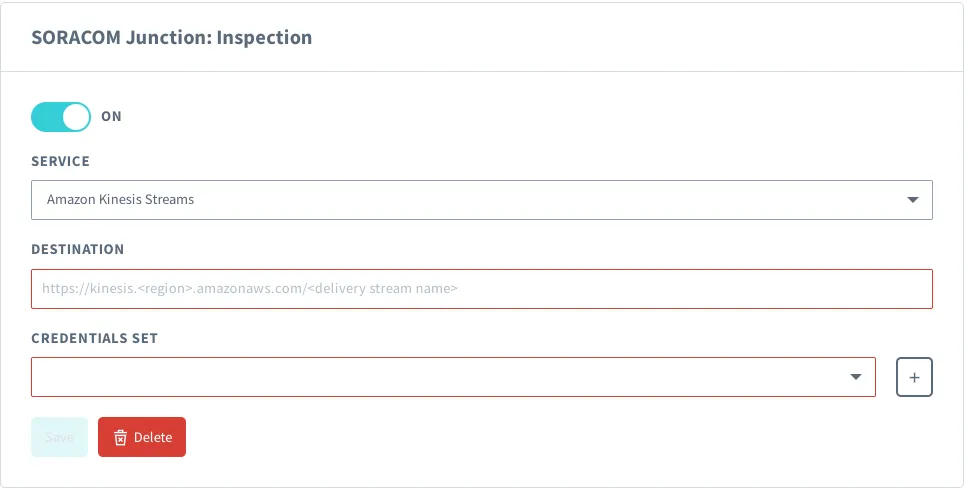
- Service - Amazon Kinesis Data Streams
- Destination - The endpoint of the Kinesis Data Stream we created, in the format of
https://kinesis.<YOUR-AWS-REGION>.amazonaws.com/<DELIVERY-STREAM-NAME>, providing the AWS region where your Kinesis Data Stream was created, and thejunction-inspection-esclouddelivery stream name we set earlier. - Credential set - A credential set containing the IAM role Role ARN and External ID we created during Kinesis Data Stream setup. For more information on creating credential sets see the Credential Sets documentation.
Once we save these settings, Junction will immediately begin sending Inspection data to our Kinesis Data Stream. Our Lambda trigger will then send the data to Elasticsearch, and we can start to visualize the VPG traffic.
If any IoT SIMs were not previously attached to the VPG, you must disconnect and reconnect their cellular connection in order to connect to the VPG.
Kibana Configuration
Now that everything is hooked up, we just need to configure our Kibana visualization.
We need to define an Index Pattern that will match the data being sent from Lambda function.
-
Log in to Kibana and click Management, then click Index Pattern.
-
Enter
soracom-*as the Index name or pattern. Then click the Create button.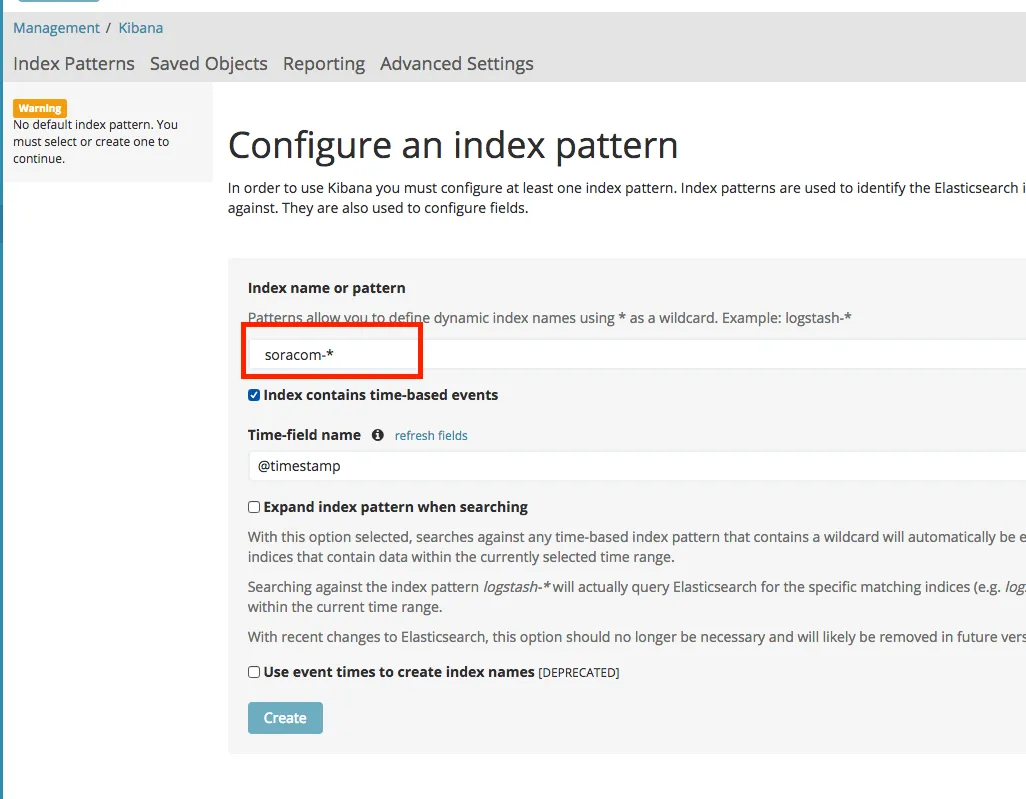
Next, let's import a dashboard template that is pre-configured.
-
Download the Soracom Realtime VPG Metrics Dashboard template file.
-
From Kibana, click Management Saved Objects. Then click the Import button, and import the dashboard template.
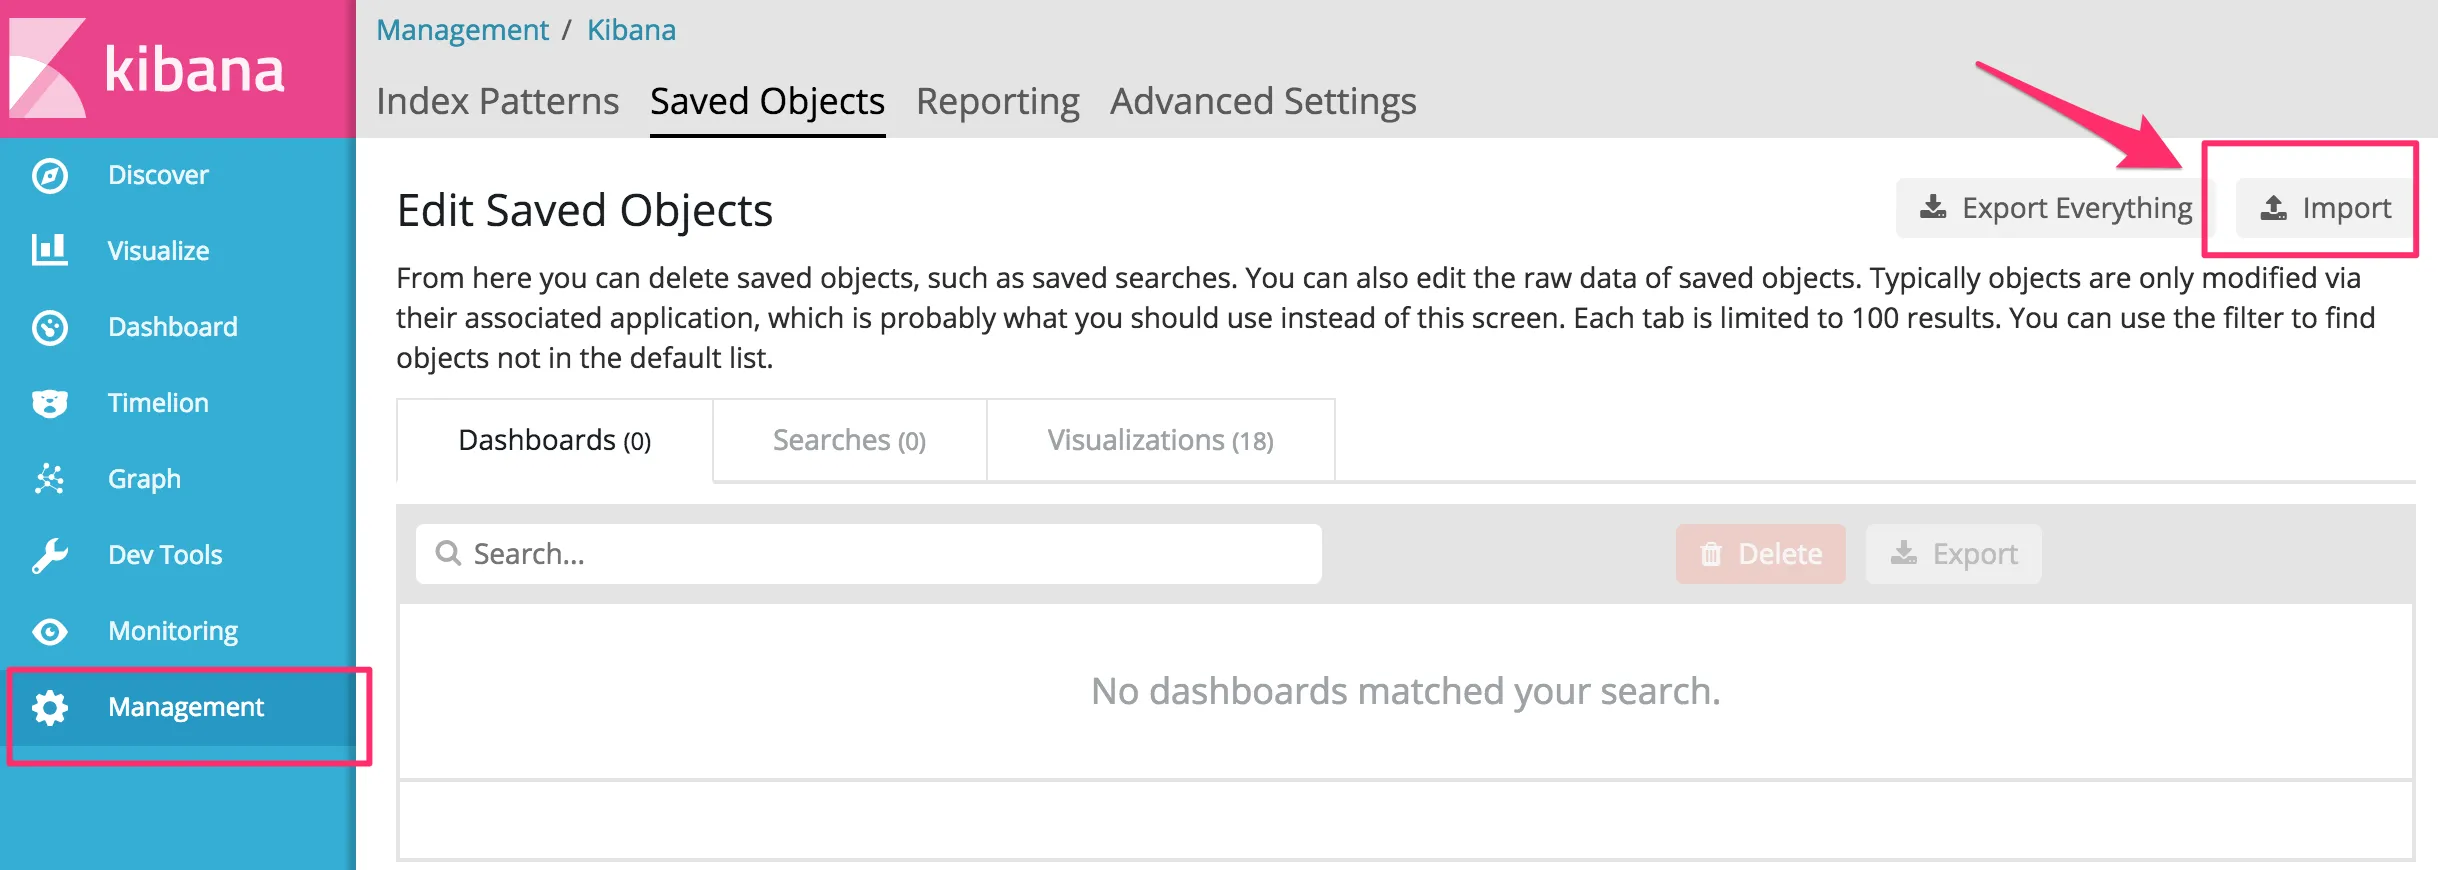
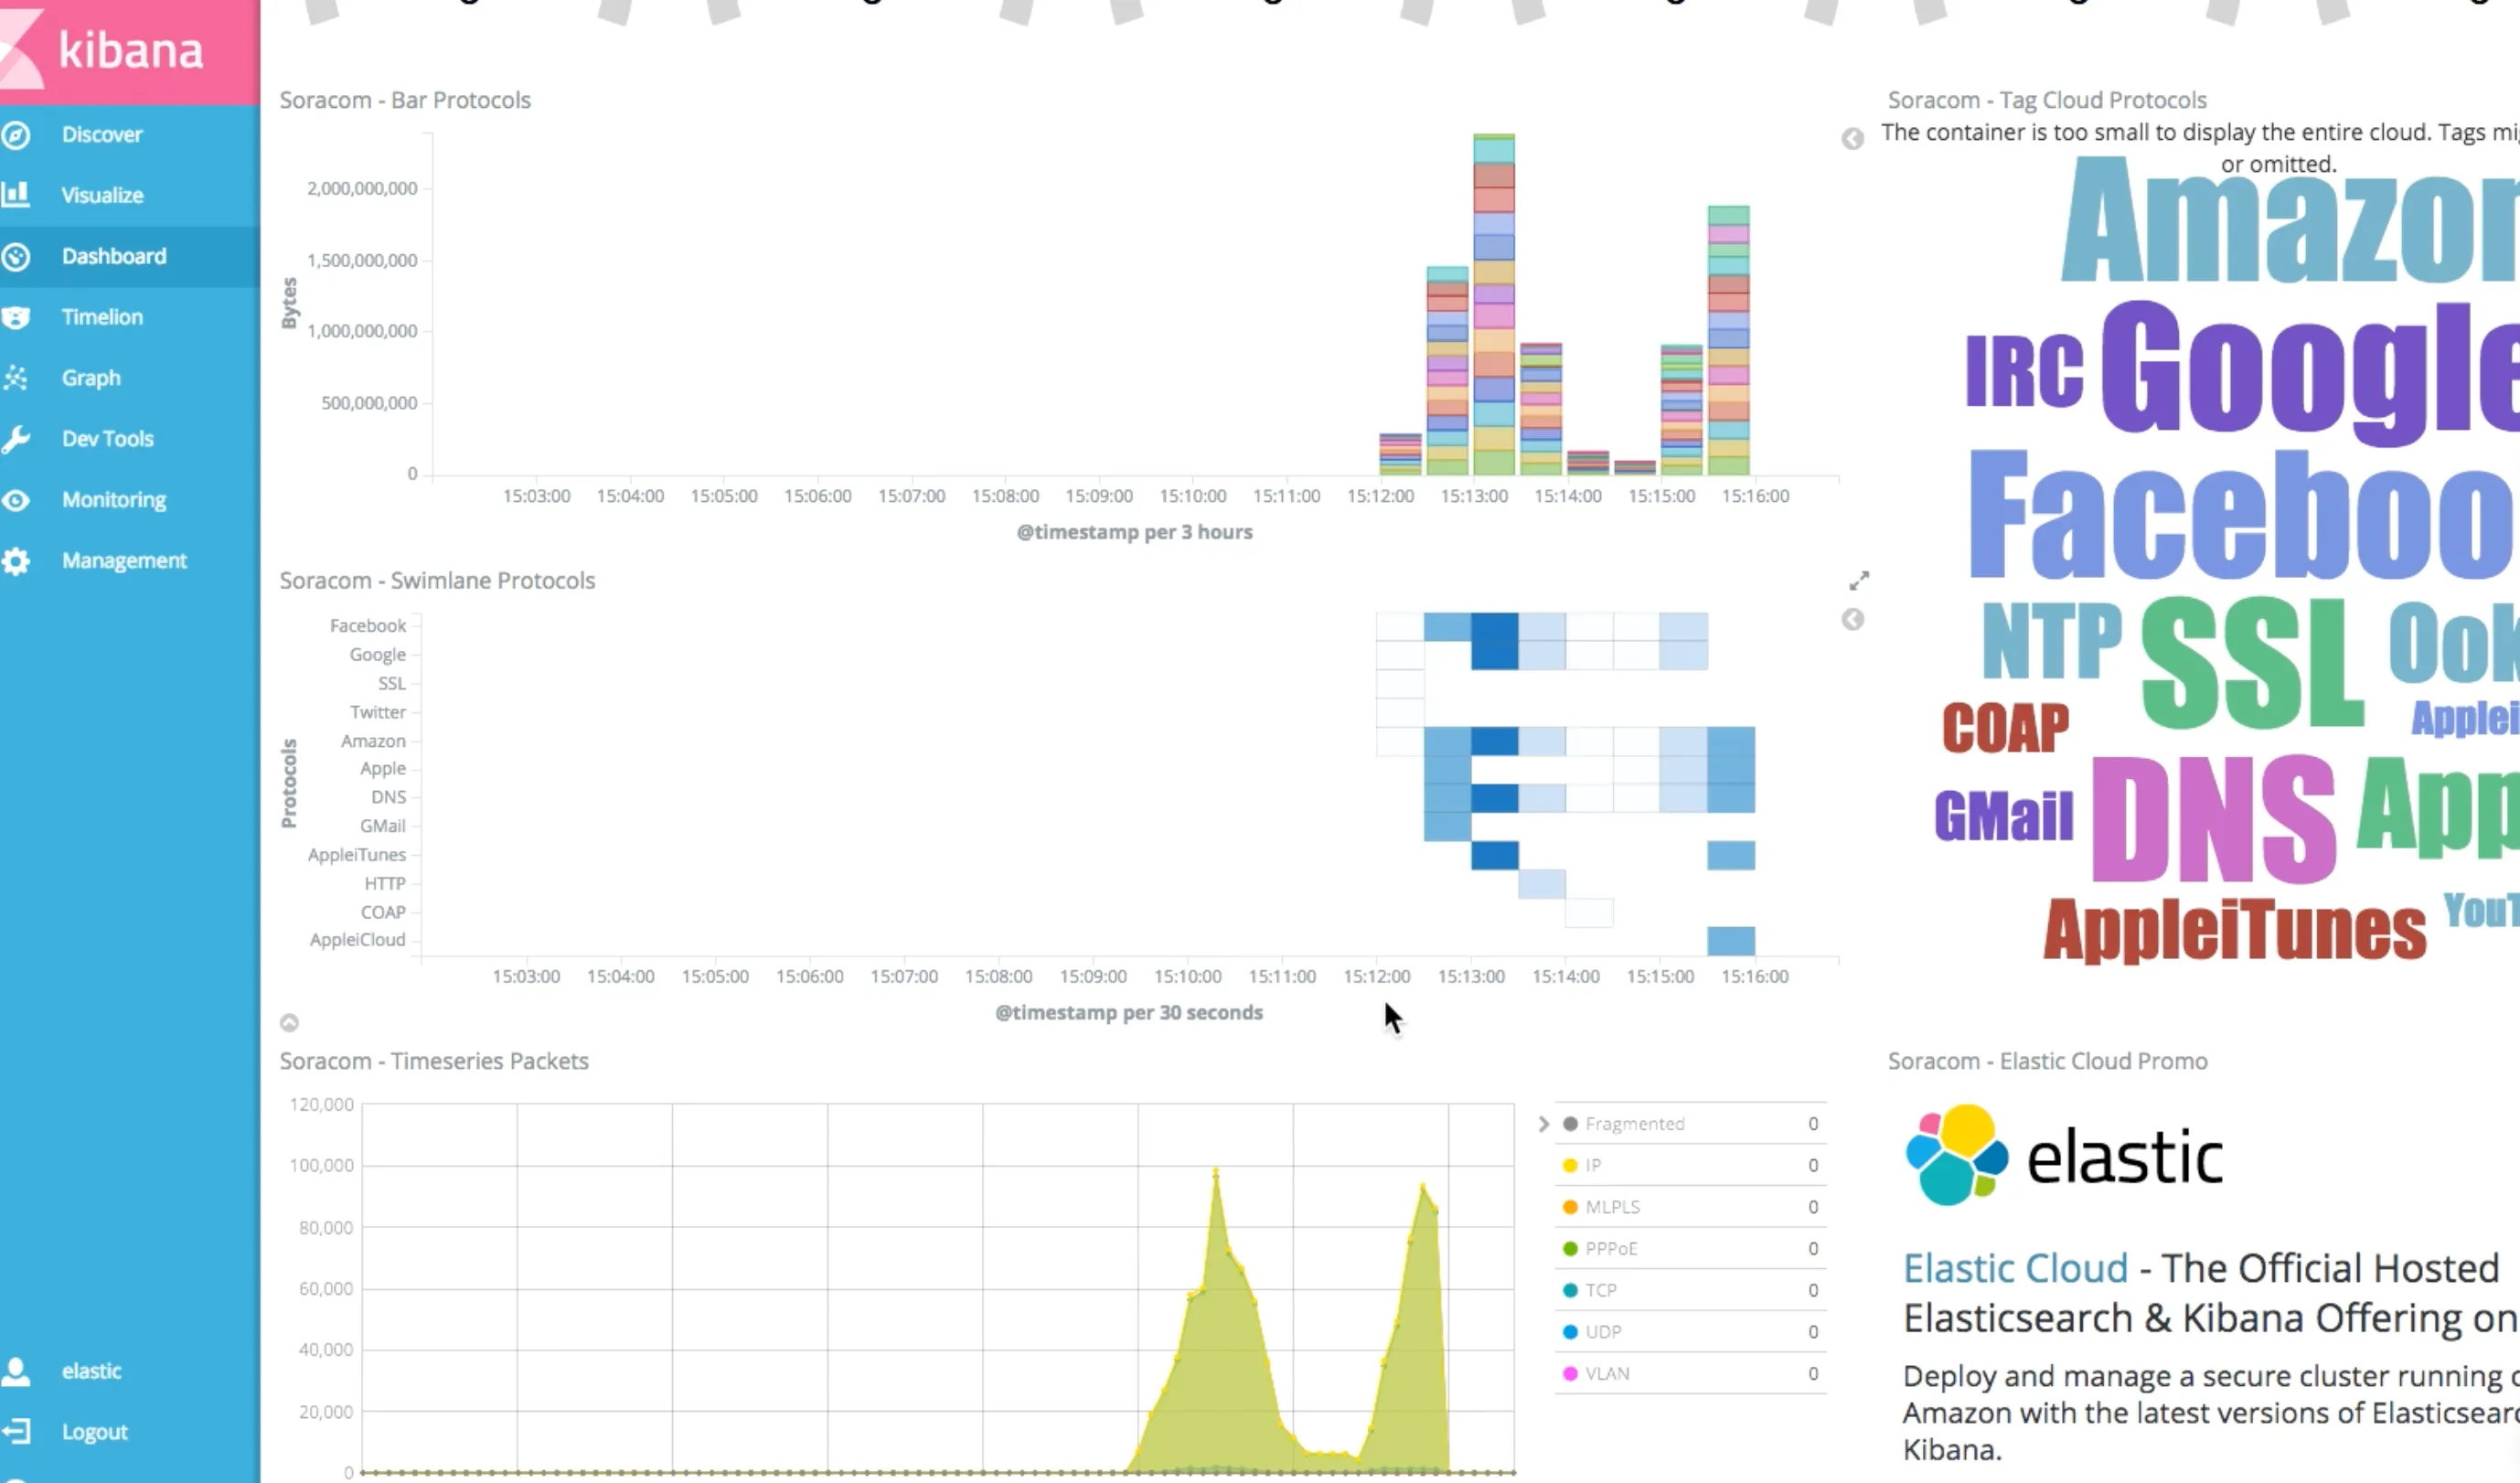
Our Inspection configuration is now fully configured. As traffic passes through our Soracom VPG, Junction will take care of parsing the packets for statistical data. Kinesis Data Streams, Lambda, and Elasticsearch will take care of handling the data, and we can now view realtime statistics from Kibana.
From Kibana, click Dashboard Soracom.
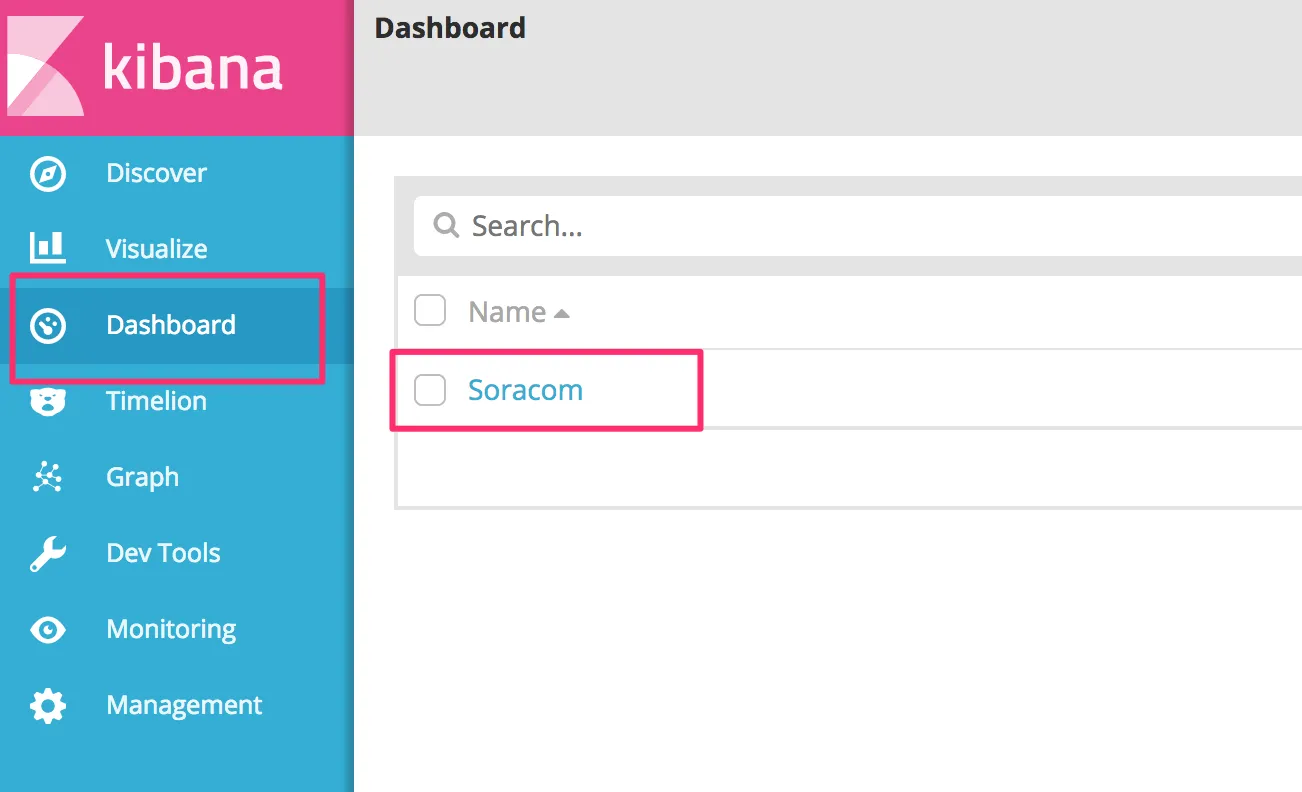
The dashboard template will include information about throughput, protocol, packet destination, and so on.